
| Category | Oct-21 | Oct-22 | Oct-23 | Oct-24 | Oct-25 | Oct-26 | Δ DoDvs. same cycle | Δ 7d MA |
|---|---|---|---|---|---|---|---|---|
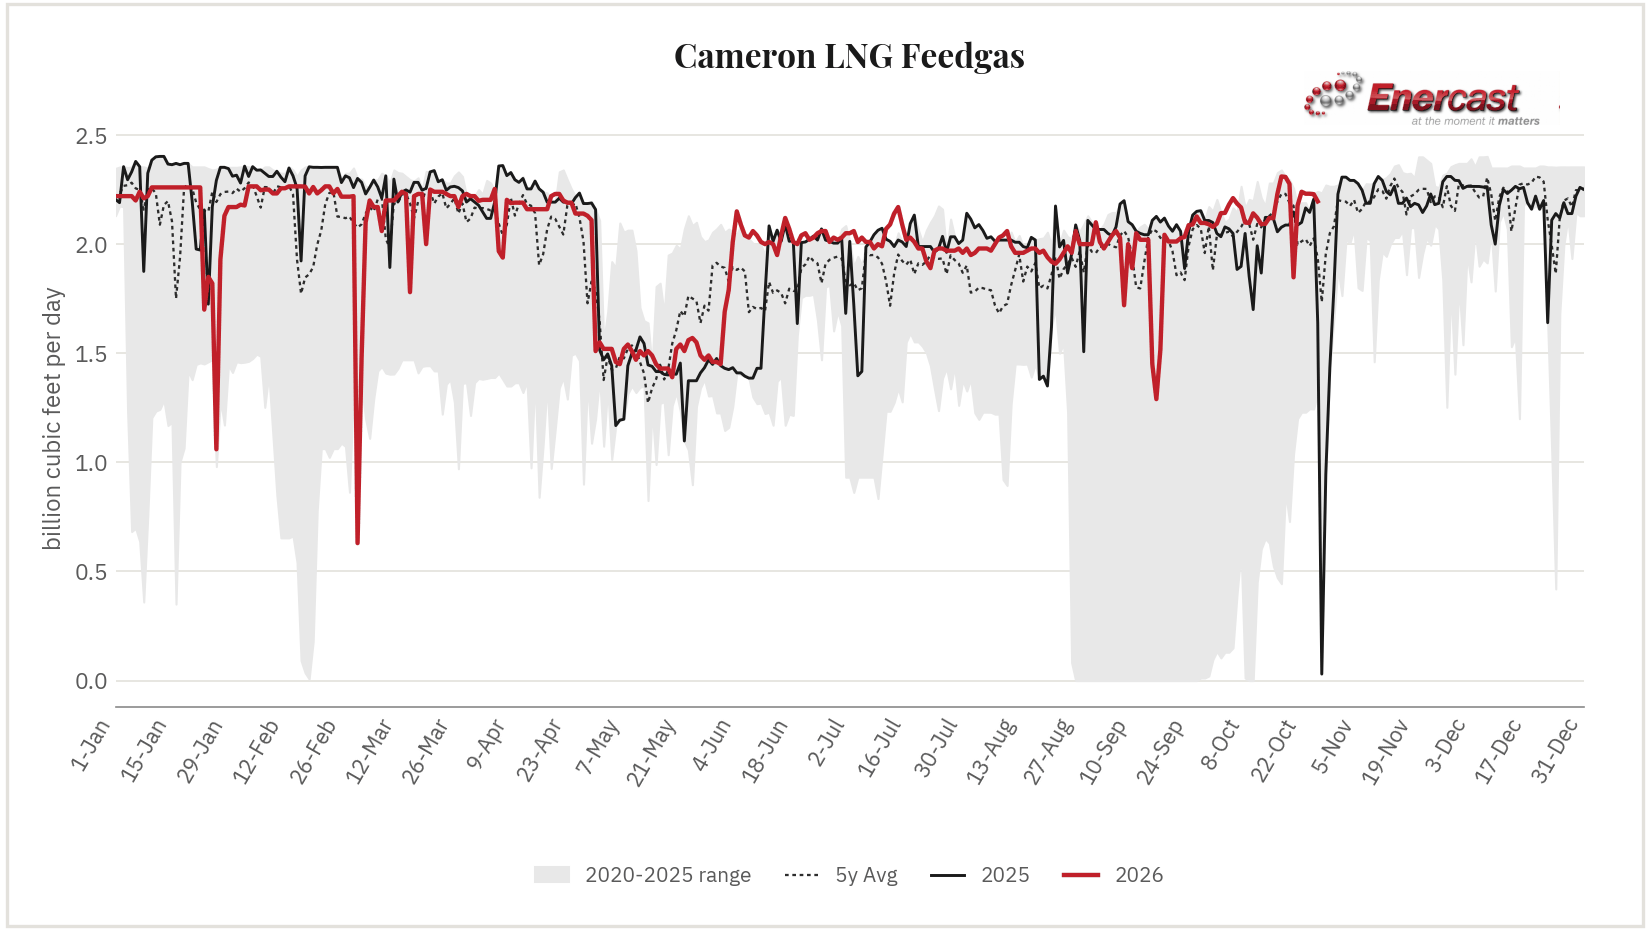
| Cameron 11.4% of total | 2.177 | 2.240 | 2.231 | 2.231 | 2.229 | 2.196 | -0.006 (-0.3%) | -0.011 (-0.5%) |
Updated daily by 7:30 AM ET for free subscribers — Pro subscribers get this update by 2:45 AM ET, plus Intra‑Day change alerts. Δ DoD compares each gas day’s first reading with the previous day’s first reading, so it measures the move rather than the overnight settling.
| Pipeline | Metered Point | Bcf/d | Δ DoD |
|---|---|---|---|
| Cameron Interstate Pipeline | CIP terminal delivery | 1.525 | -0.033 (-2.1%) |
| Columbia Gulf Transmission (CGT) | CGT leg | 0.671 | +0.000 (+0.0%) |
2 metered interconnects posting for this gas day. Each figure is that meter’s own scheduled quantity as posted by the pipeline — not an estimate or an apportionment. Δ DoD here compares yesterday’s posting to today’s at the same meter; unlike the trend table above it is not a same-cycle comparison, because no first-reading snapshot is kept per meter.
Cameron is one of nine U.S. LNG export terminals Enercast tracks daily. See total U.S. LNG feedgas for the national picture and every terminal’s chart.