
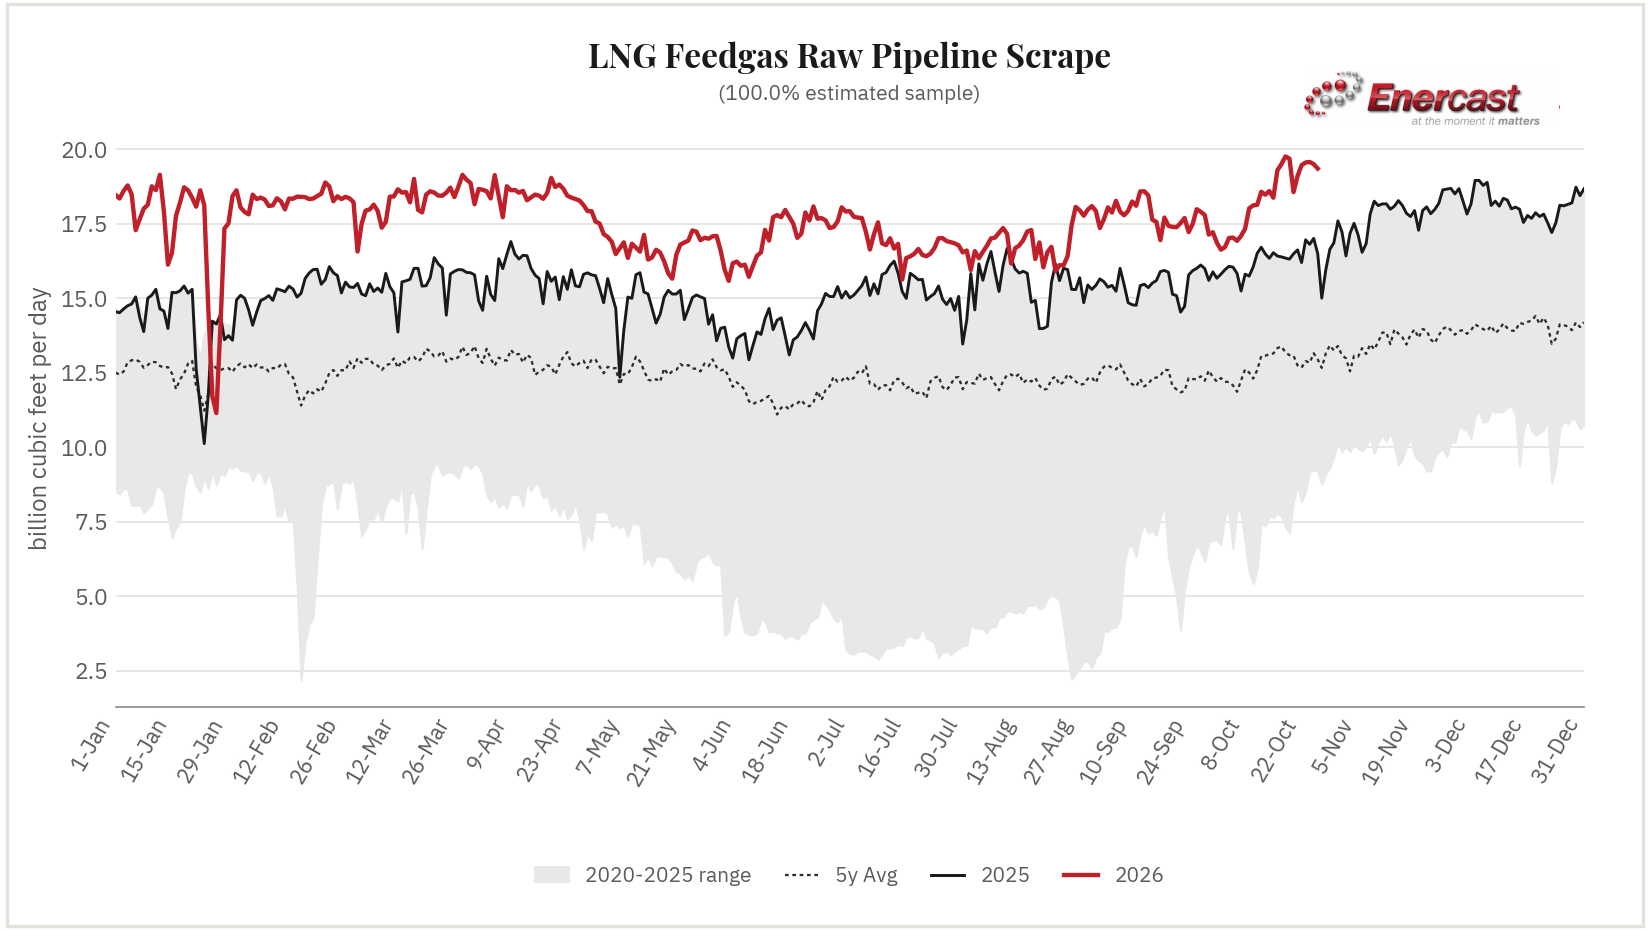
Tracks metered deliveries at each LNG export terminal’s feed-gas interconnect.
| Category | Oct-21 | Oct-22 | Oct-23 | Oct-24 | Oct-25 | Oct-26 | Δ DoDvs. same cycle | Δ 7d MA |
|---|---|---|---|---|---|---|---|---|
| LNG Feedgas | 19.097 | 19.462 | 19.552 | 19.570 | 19.496 | 19.347 | -0.187 (-1.0%) | -0.048 (-0.2%) |
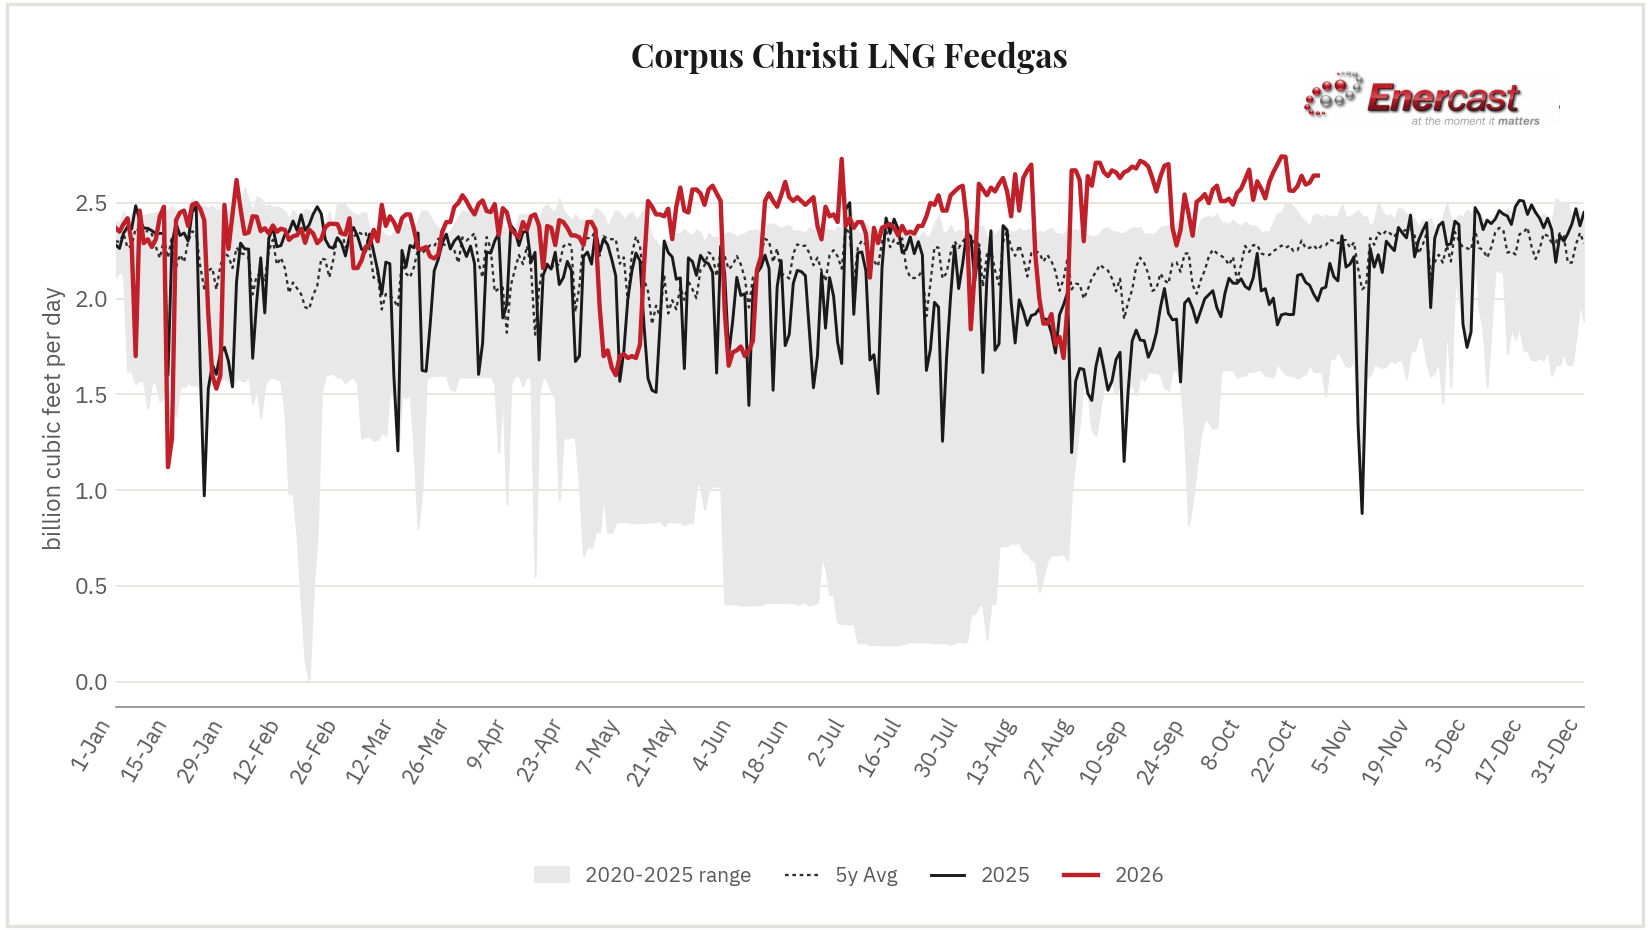
| ↳Corpus Christi 13.7% of total | 2.588 | 2.642 | 2.596 | 2.606 | 2.643 | 2.643 | -0.060 (-2.2%) | +0.011 (+0.4%) |
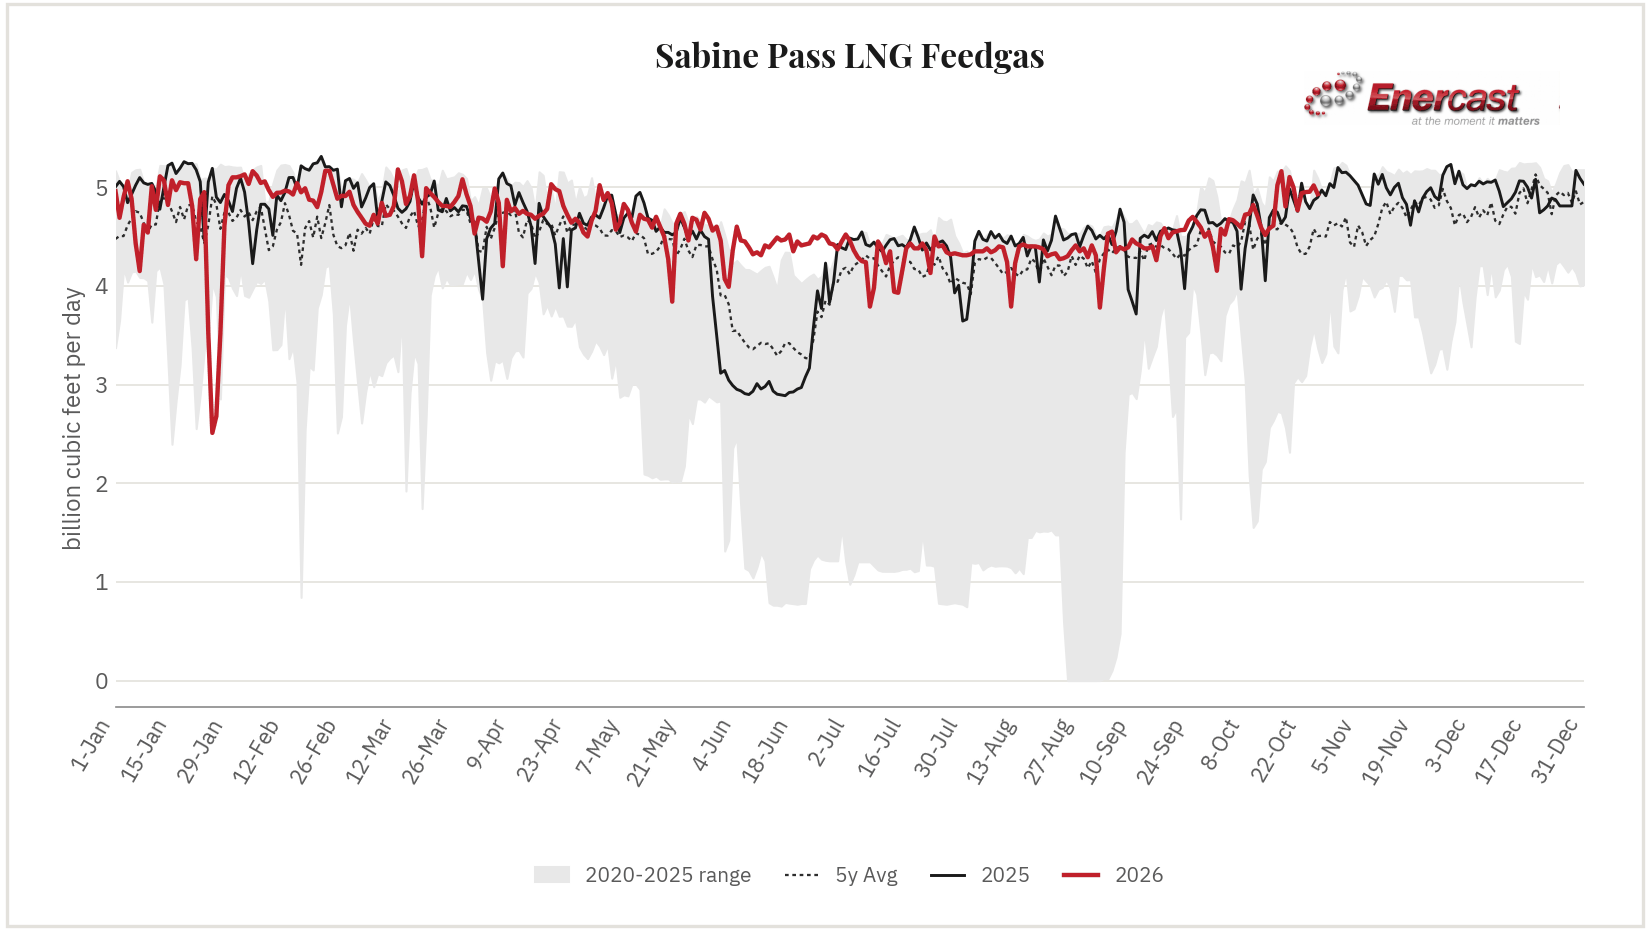
| ↳Sabine Pass 25.5% of total | 4.765 | 4.939 | 4.950 | 4.954 | 5.018 | 4.929 | -0.037 (-0.7%) | -0.025 (-0.5%) |
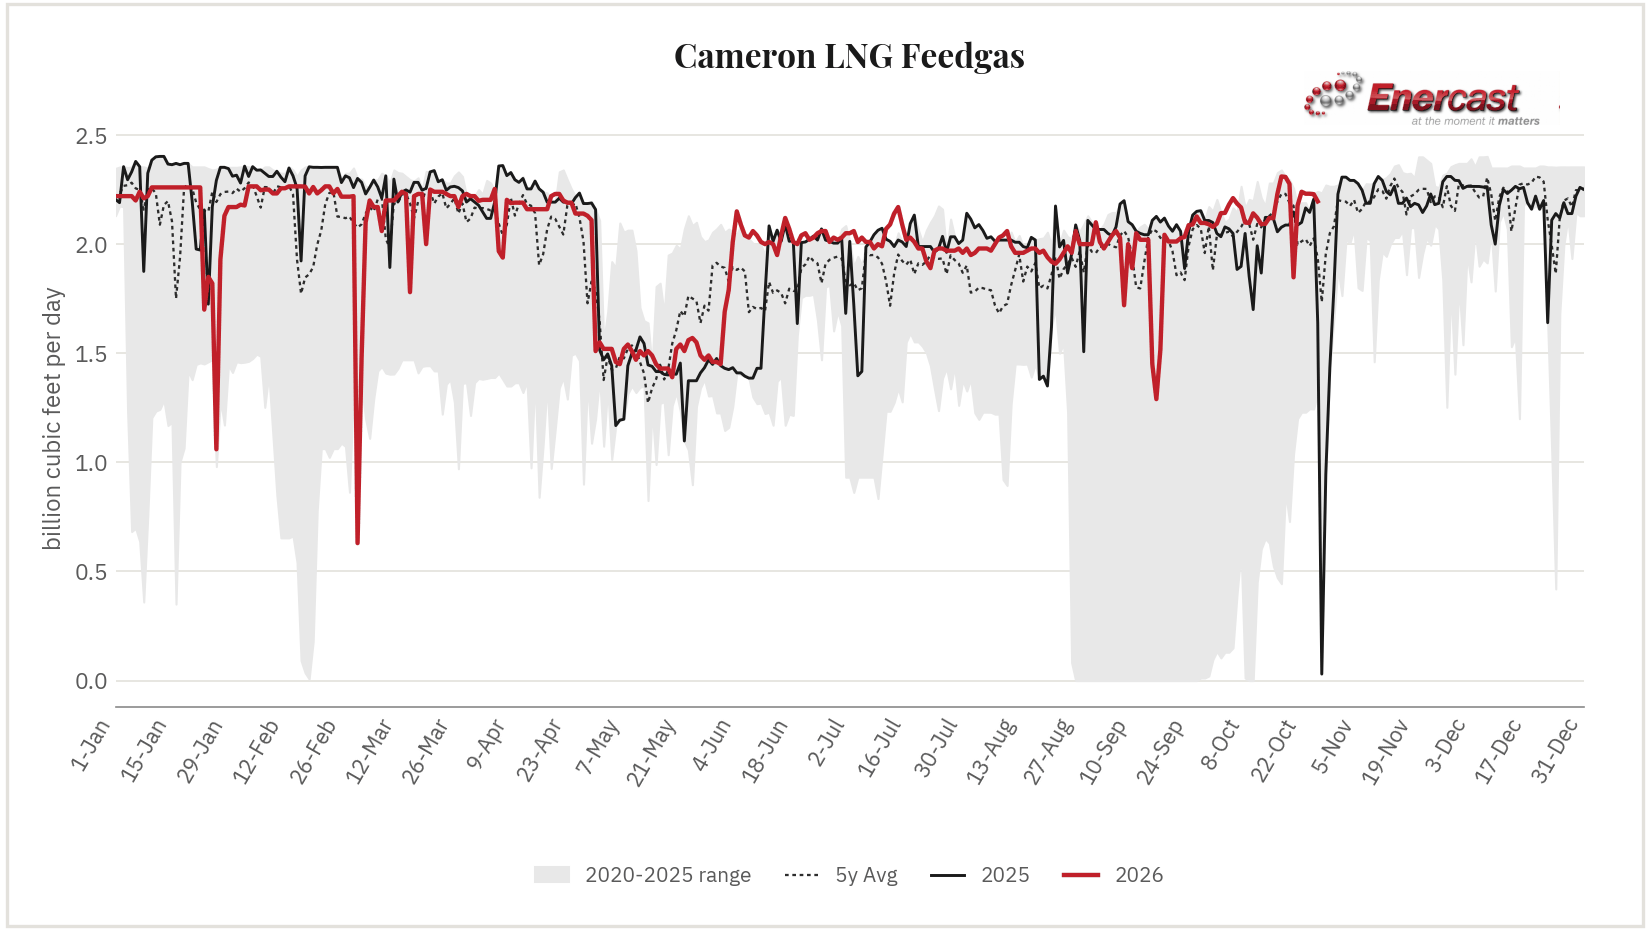
| ↳Cameron 11.4% of total | 2.177 | 2.240 | 2.231 | 2.231 | 2.229 | 2.196 | -0.006 (-0.3%) | -0.011 (-0.5%) |
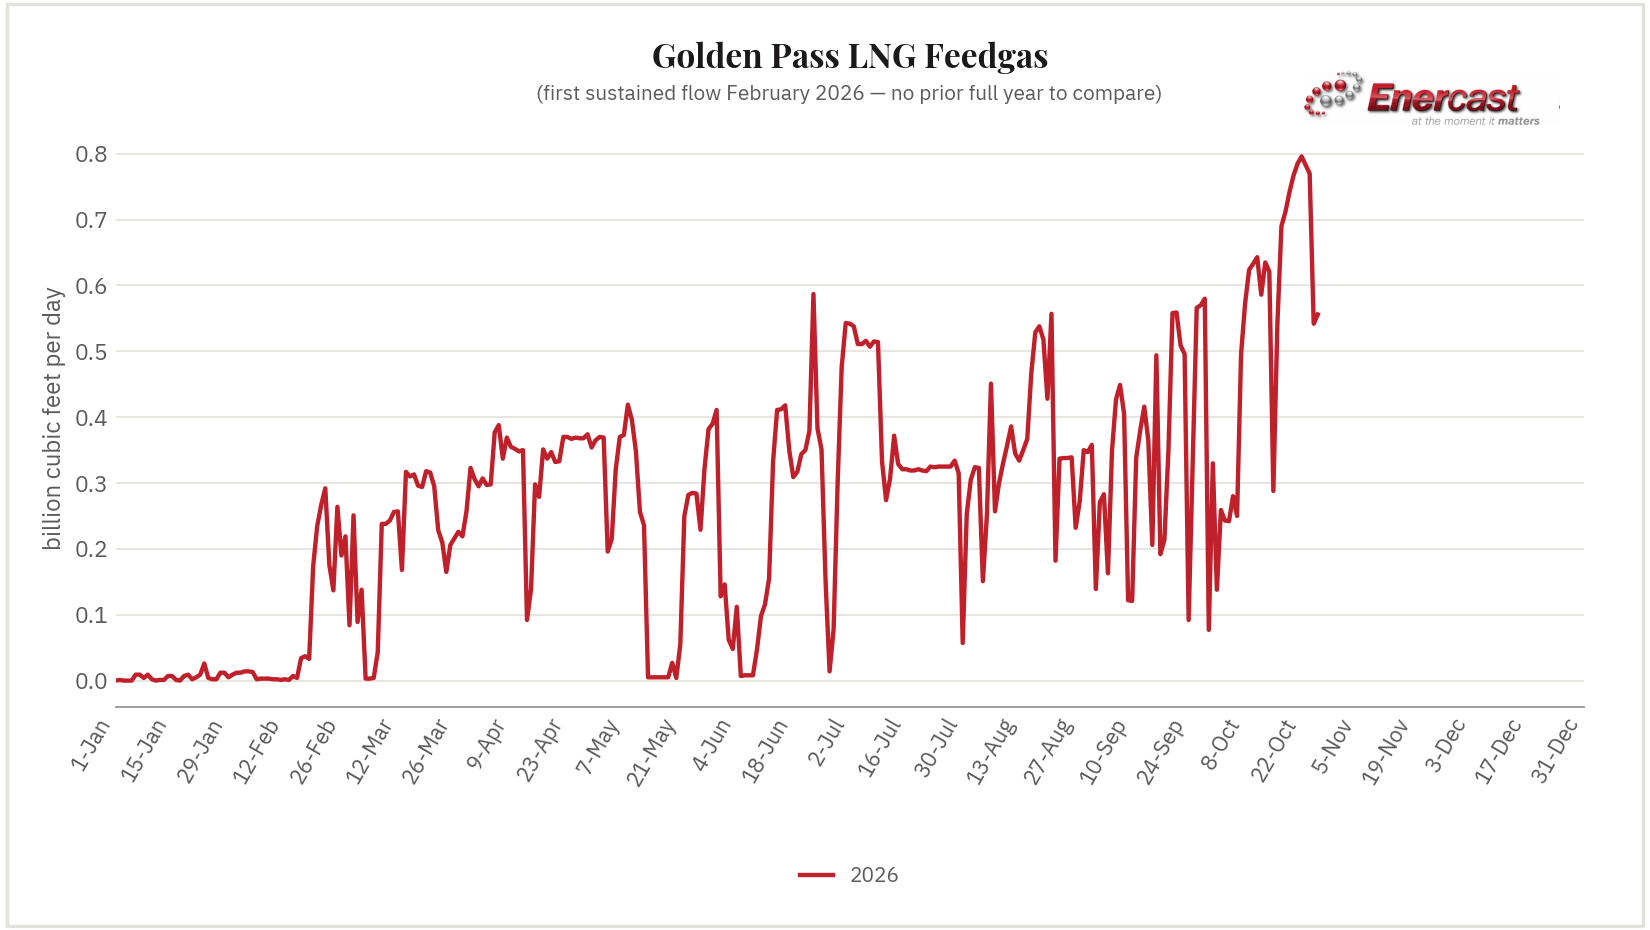
| ↳Golden Pass 2.9% of total | 0.785 | 0.796 | 0.783 | 0.770 | 0.542 | 0.556 | -0.099 (-15.1%) | -0.027 (-3.6%) |
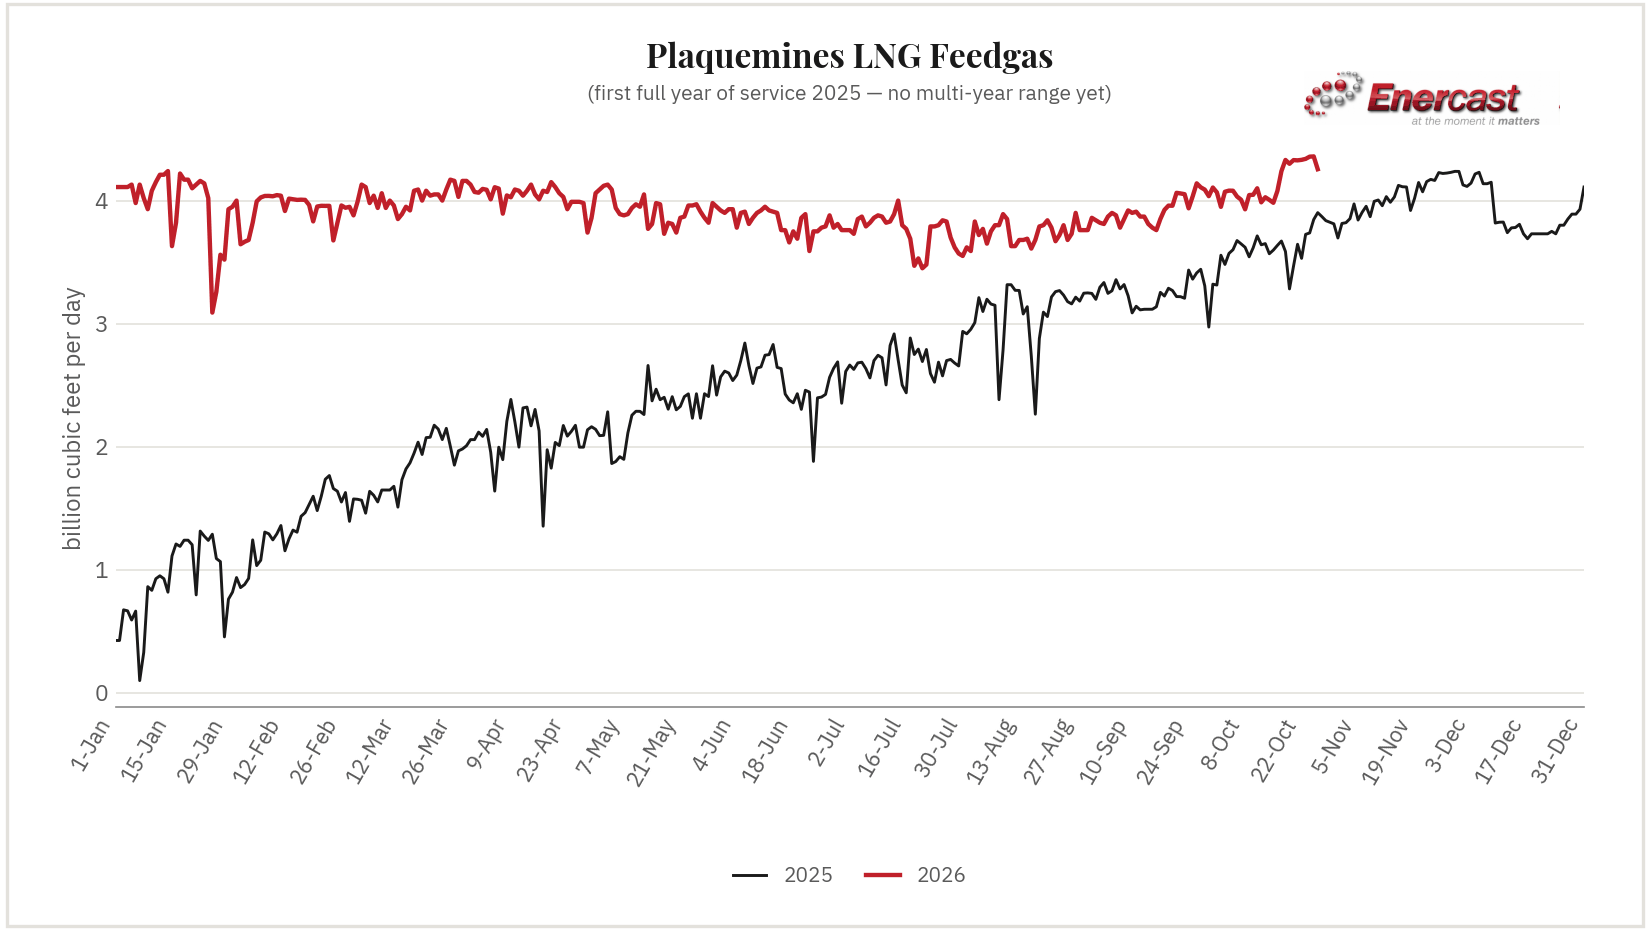
| ↳Plaquemines 22.0% of total | 4.327 | 4.331 | 4.339 | 4.357 | 4.359 | 4.255 | -0.099 (-2.3%) | -0.006 (-0.1%) |
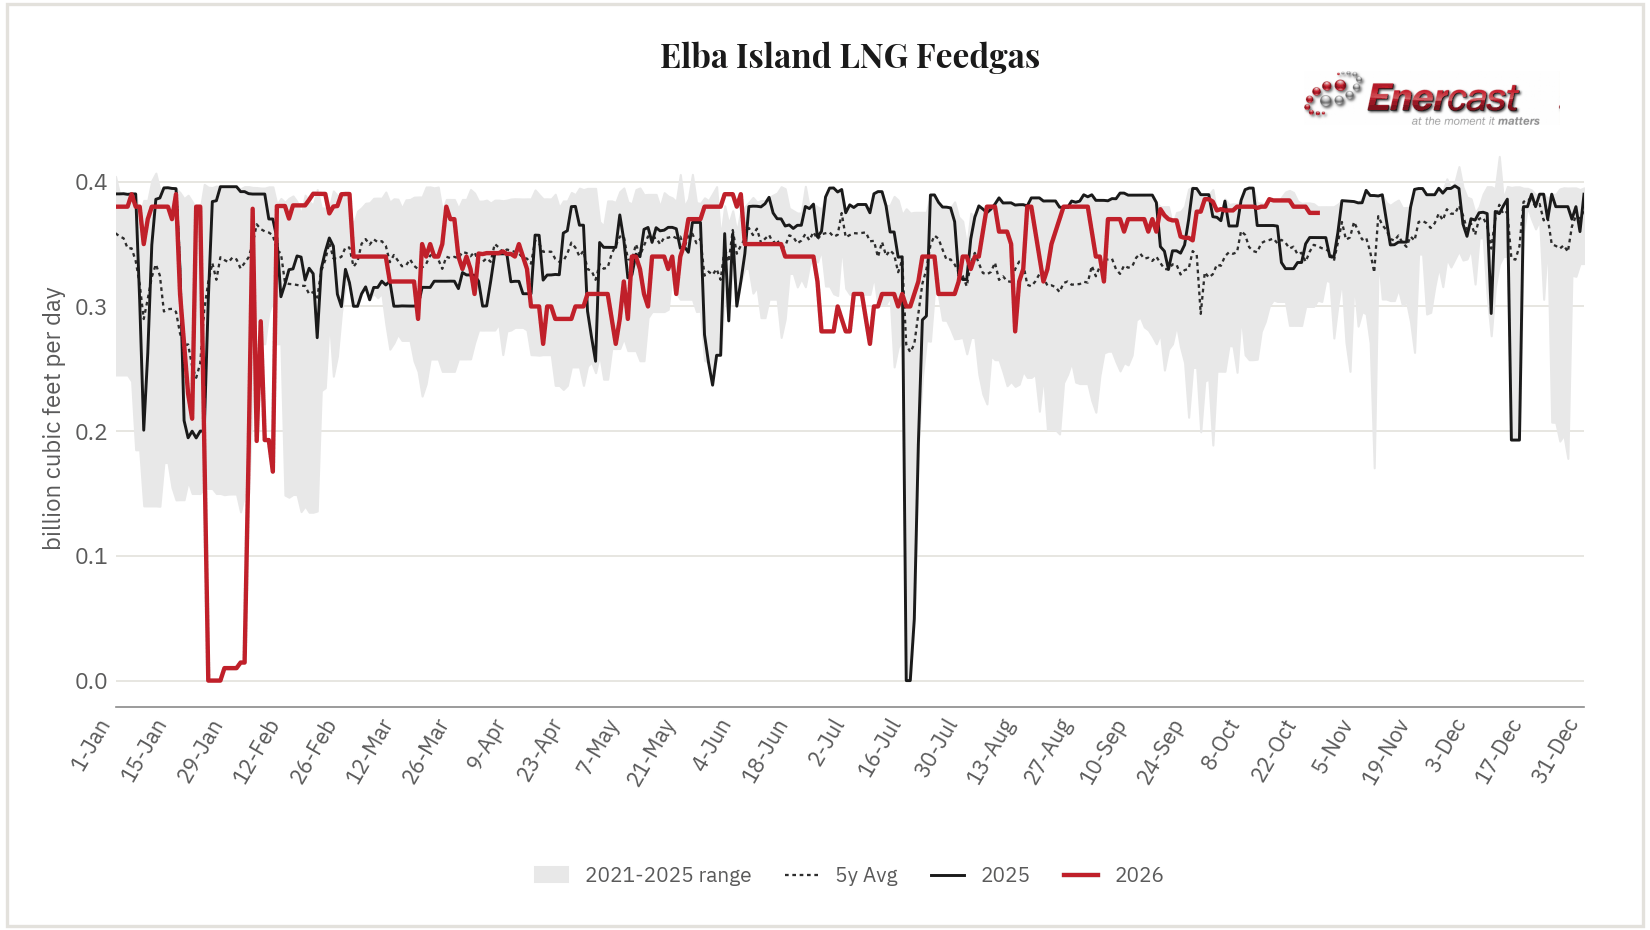
| ↳Elba Island 1.9% of total | 0.380 | 0.380 | 0.380 | 0.375 | 0.375 | 0.375 | +0.000 (+0.0%) | -0.001 (-0.3%) |
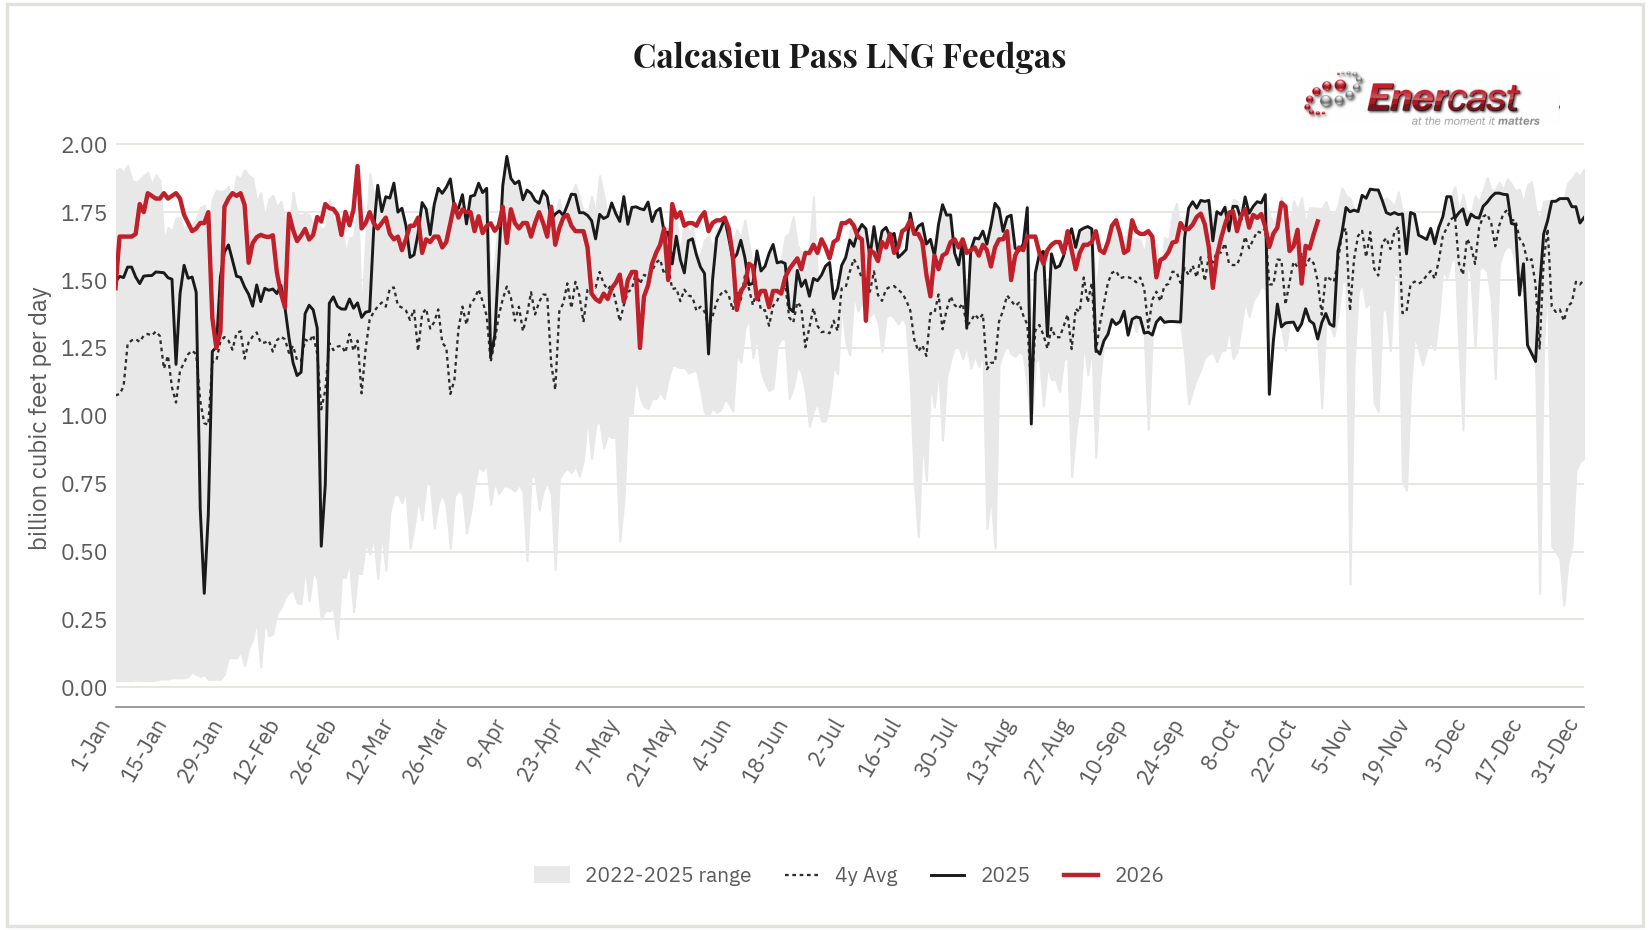
| ↳Calcasieu Pass 8.9% of total | 1.685 | 1.487 | 1.626 | 1.616 | 1.669 | 1.716 | +0.098 (+6.1%) | +0.016 (+1.0%) |
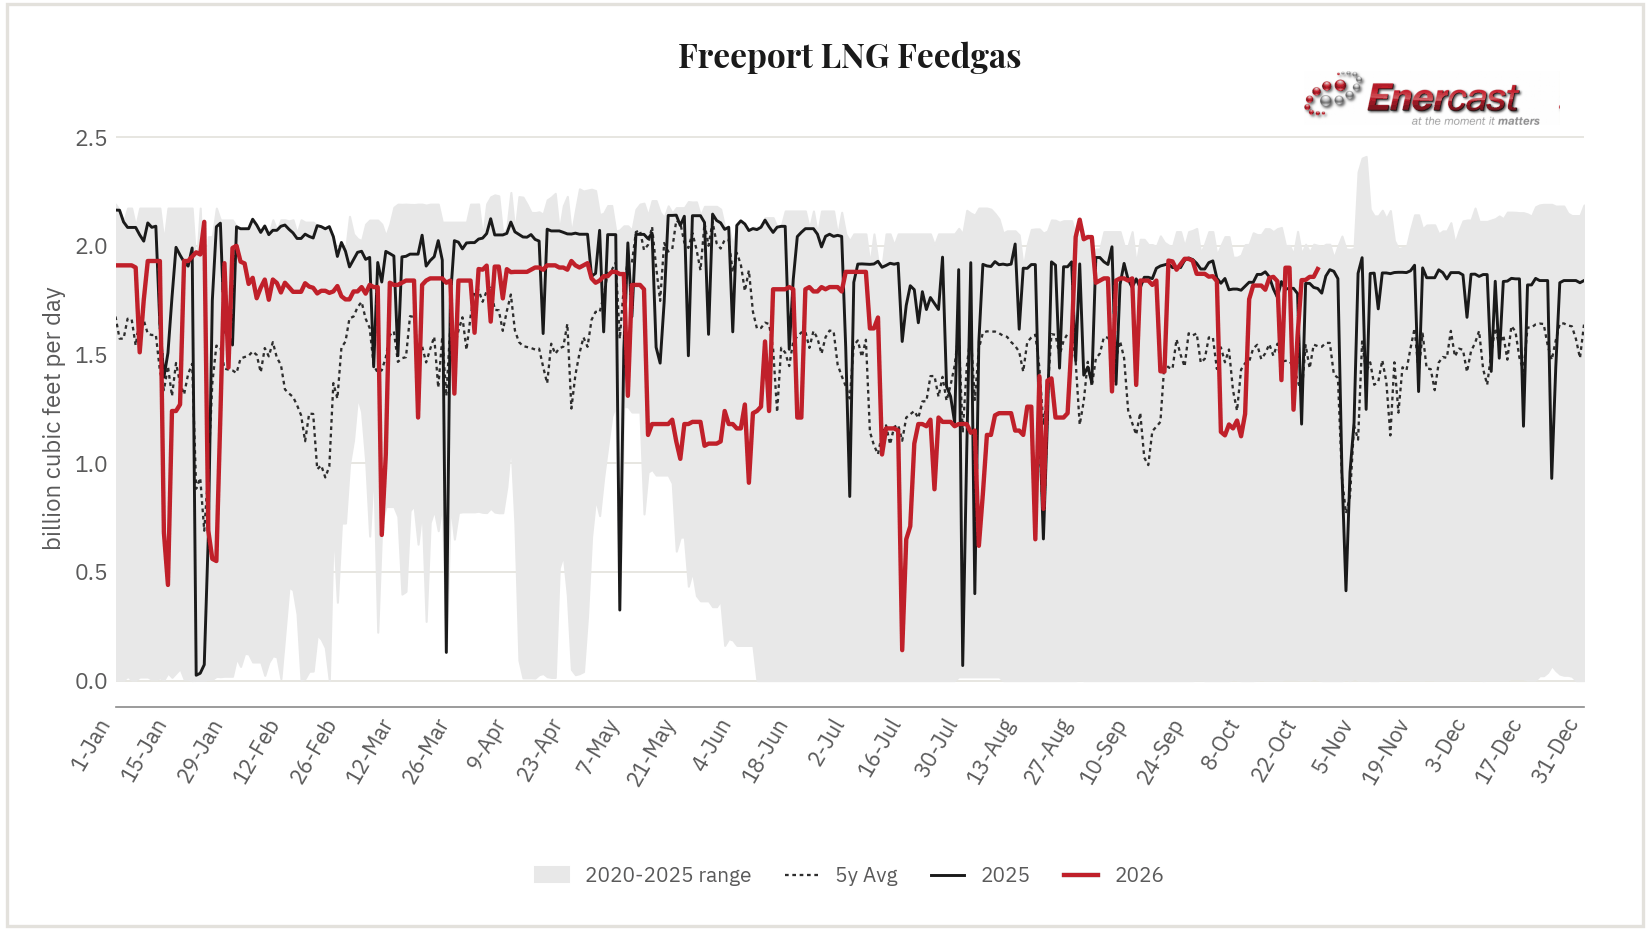
| ↳Freeport 9.8% of total | 1.586 | 1.842 | 1.843 | 1.857 | 1.857 | 1.893 | +0.017 (+0.9%) | -0.001 (-0.1%) |
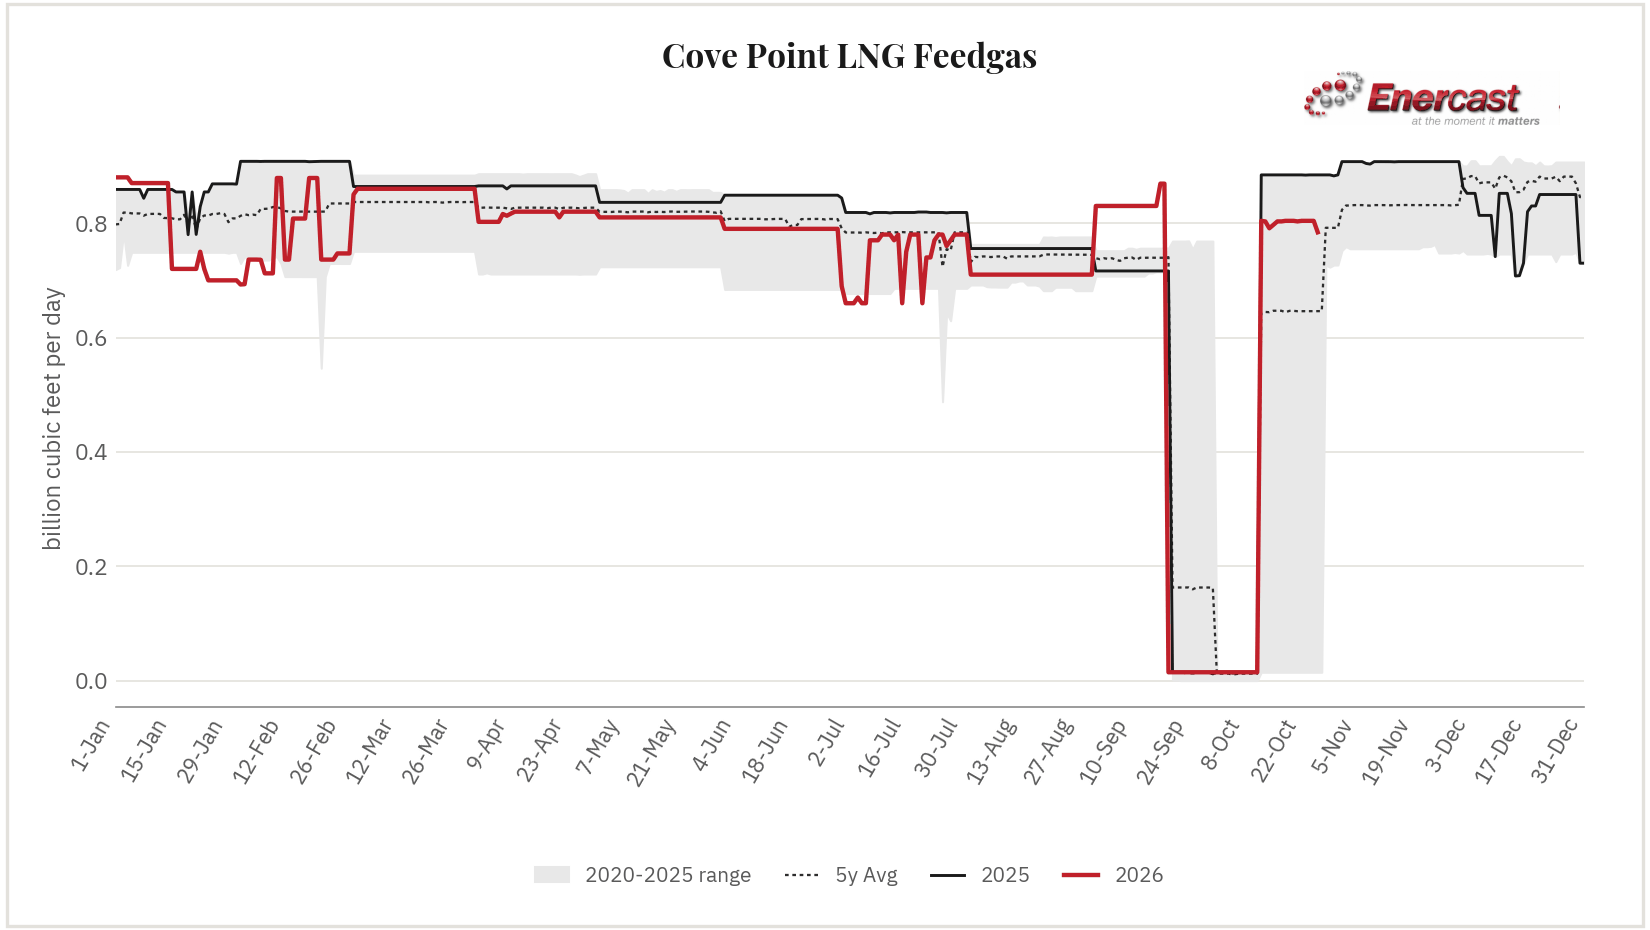
| ↳Cove Point 4.1% of total | 0.803 | 0.804 | 0.804 | 0.804 | 0.804 | 0.784 | +0.000 (+0.0%) | -0.003 (-0.4%) |
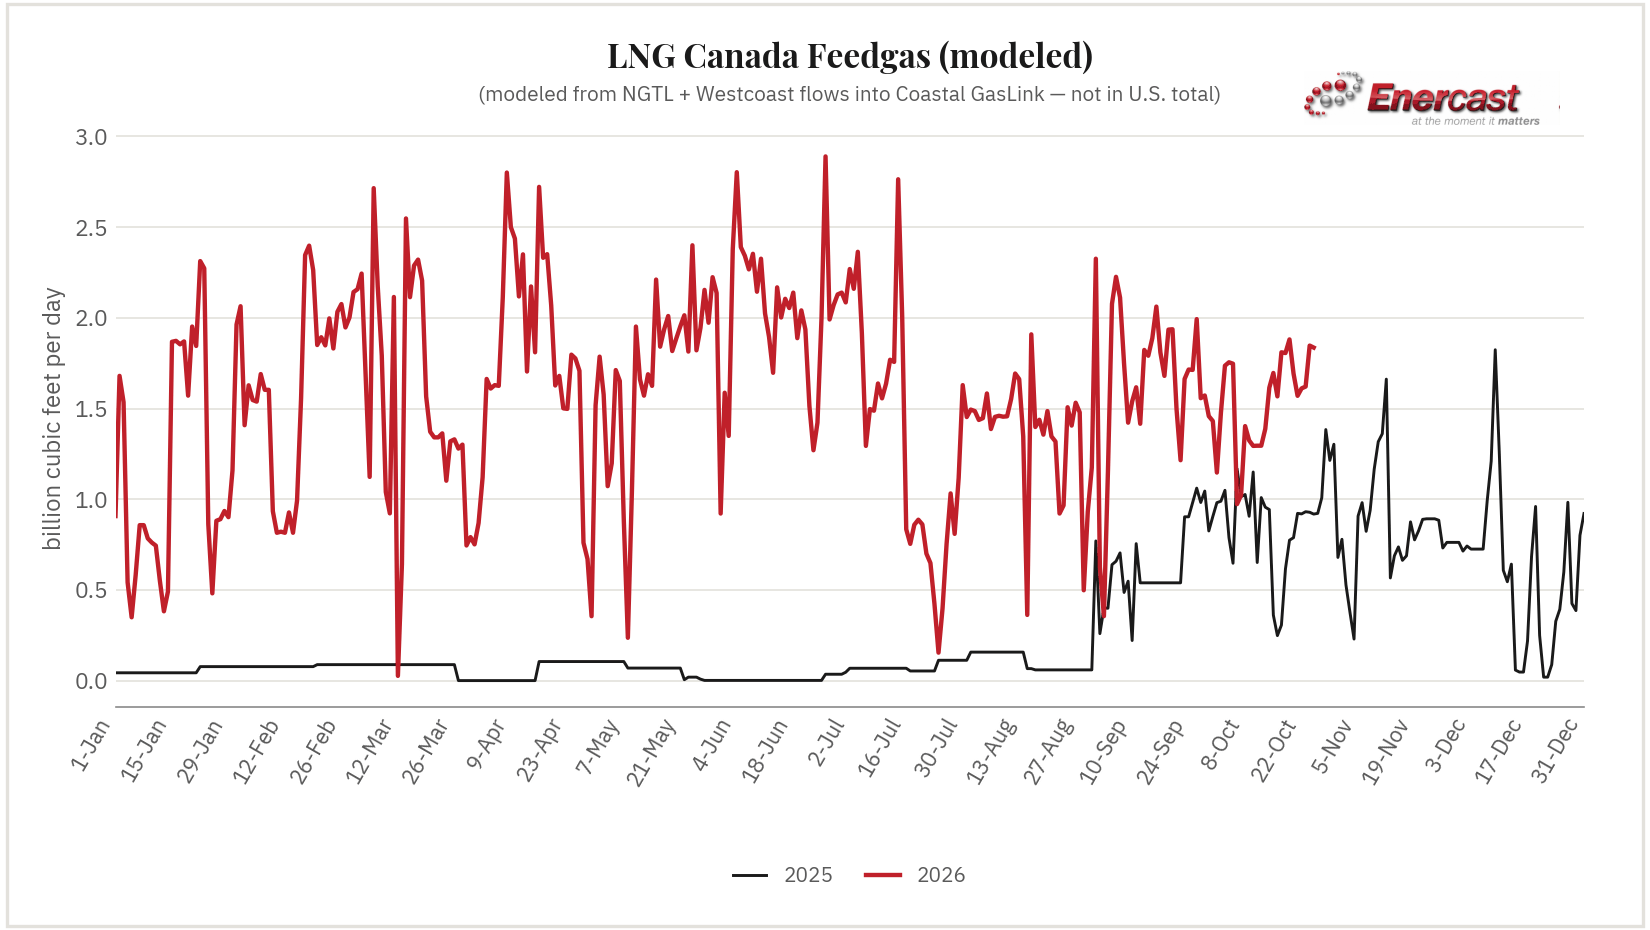
| Canada — not included in the U.S. total above | ||||||||
| LNG Canada modeled estimate | 1.570 | 1.611 | 1.621 | 1.847 | 1.836 | Pending | -0.011 (-0.6%) | +0.004 (+0.2%) |
Updated daily by 7:30 AM ET for free subscribers — Pro subscribers get this update by 2:45 AM ET, plus Intra‑Day change alerts. Sub-category rows are the parts this total is summed from — measured at separate, non-overlapping meters, so they add to the total for any gas day computed in a single run. Δ DoD compares each gas day’s first reading with the previous day’s first reading, so it measures the move rather than the overnight settling.
| Pipeline | Meter / Interconnect | Location | Gas Day Bcf/d | Δ DoD | Δ 7d MA |
|---|---|---|---|---|---|
| Venture Global Gator Express | Plaquemines -- Gator Express terminal delivery | Gulf Coast | 4.255 | -0.104 (-2.4%) | -0.006 (-0.1%) |
| Corpus Christi LNG | Corpus Christi (Cheniere) | Gulf Coast | 2.643 | +0.000 (+0.0%) | +0.011 (+0.4%) |
| TransCameron Pipeline | Calcasieu Pass -- TransCameron terminal delivery | Gulf Coast | 1.716 | +0.047 (+2.8%) | +0.016 (+1.0%) |
| Sabine Pass LNG | Sabine Pass -- Creole Trail leg | Gulf Coast | 1.540 | +0.000 (+0.0%) | -0.000 (-0.0%) |
| Cameron Interstate Pipeline | Cameron -- CIP terminal delivery | Gulf Coast | 1.525 | -0.033 (-2.1%) | -0.003 (-0.2%) |
| Kinder Morgan Louisiana Pipeline | Sabine -- KMLP terminal delivery | Gulf Coast | 1.519 | -0.009 (-0.6%) | -0.002 (-0.1%) |
| Gulf South Pipeline | Freeport -- Gulf South Stratton Ridge leg | Gulf Coast | 1.442 | -0.000 (-0.0%) | -0.003 (-0.2%) |
| Transco | Sabine Pass -- Transco Lighthouse Road delivery | Gulf Coast | 1.152 | -0.047 (-3.9%) | -0.007 (-0.6%) |
| CPL | Cove Point -- CPL Plant delivery | Northeast | 0.784 | -0.020 (-2.5%) | -0.003 (-0.4%) |
| Natural Gas Pipeline (NGPL) | Sabine Pass -- NGPL direct leg | Gulf Coast | 0.718 | -0.033 (-4.4%) | -0.017 (-2.3%) |
| Columbia Gulf Transmission (CGT) | Cameron LNG -- CGT leg | Gulf Coast | 0.671 | +0.000 (+0.0%) | -0.008 (-1.2%) |
| Golden Pass Pipeline | Golden Pass -- Terminal meter | Gulf Coast | 0.556 | +0.014 (+2.6%) | -0.027 (-3.6%) |
| Elba Express Company | Elba Island -- Elba Express into Elba Liquefaction Co. (ELC) | Southeast | 0.375 | +0.000 (+0.0%) | -0.001 (-0.3%) |
| Texas Eastern Transmission (TETCO) | Freeport -- TETCO into BIG (Brazoria Interconnector) | Gulf Coast | 0.248 | +0.036 (+17.0%) | +0.002 (+1.0%) |
| Texas Eastern Transmission (TETCO) | Freeport -- TETCO into Stratton Ridge (ambiguous) | Gulf Coast | 0.203 | -0.000 (-0.0%) | -0.000 (-0.0%) |
Showing all 15 locations in PipeScrape's registry for this category that posted a real capacity_postings figure for this gas day — the entire tracked universe, not a sample. Each value is that meter's own real, measured scheduled quantity for this gas day (not an estimate or apportionment).