
| Category | Oct-21 | Oct-22 | Oct-23 | Oct-24 | Oct-25 | Oct-26 | Δ DoDvs. same cycle | Δ 7d MA |
|---|---|---|---|---|---|---|---|---|
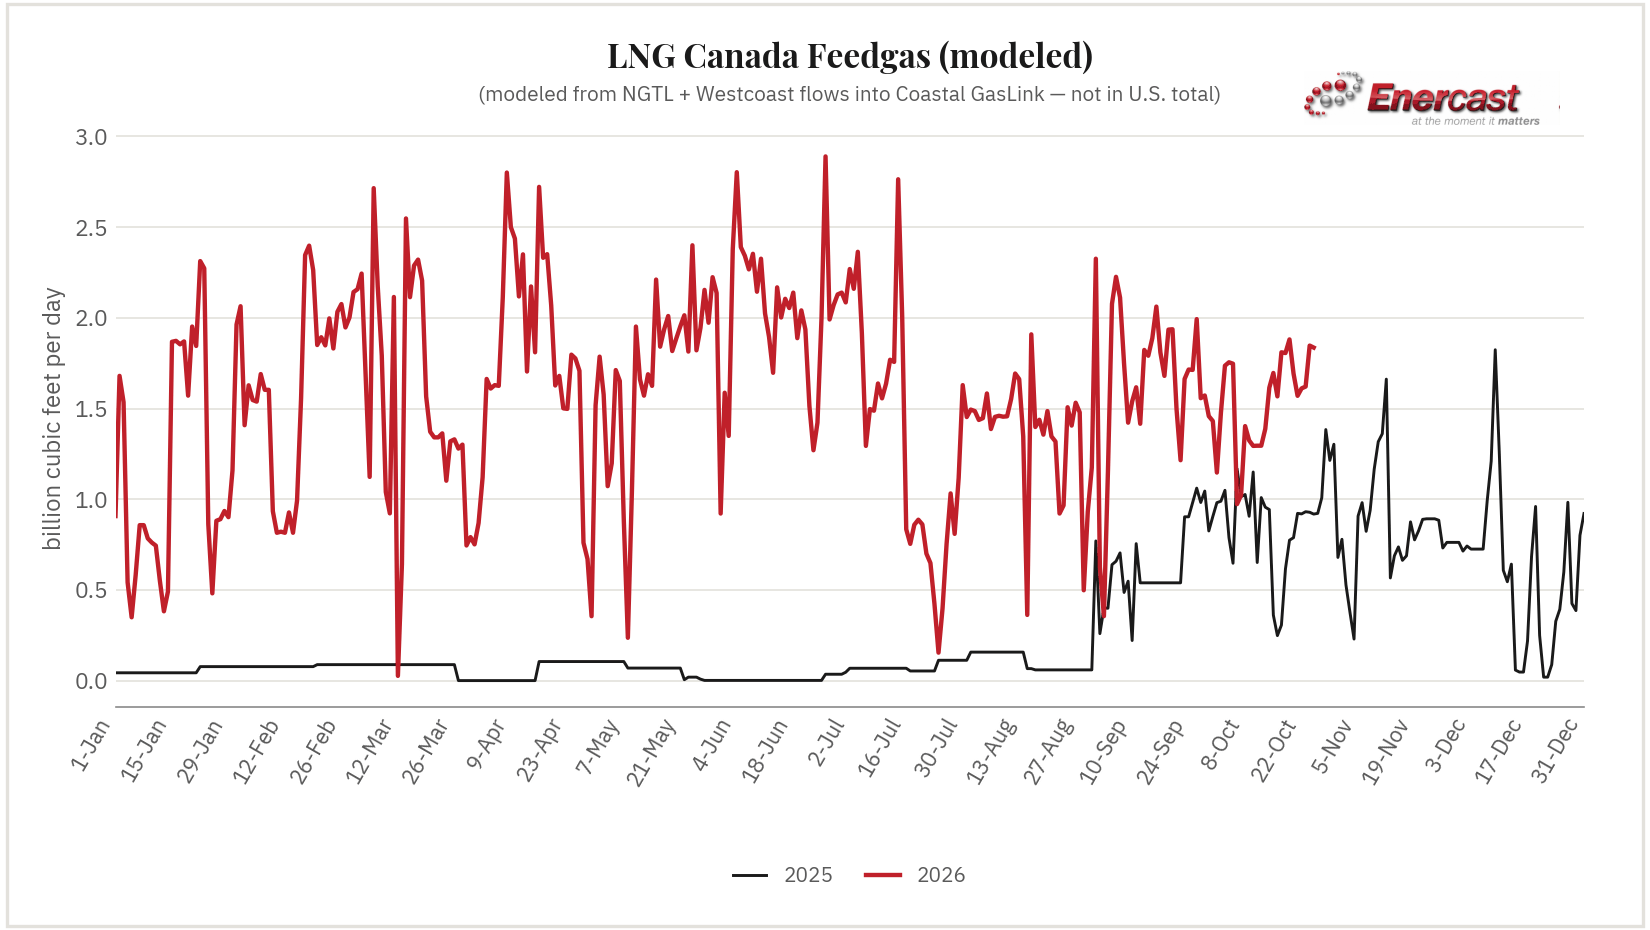
| LNG Canada modeled estimate | 1.570 | 1.611 | 1.621 | 1.847 | 1.836 | Pending | -0.011 (-0.6%) | +0.004 (+0.2%) |
Updated daily by 7:30 AM ET for free subscribers — Pro subscribers get this update by 2:45 AM ET, plus Intra‑Day change alerts. Δ DoD compares each gas day’s first reading with the previous day’s first reading, so it measures the move rather than the overnight settling.
| Pipeline | Metered Point | As Posted | Δ DoD |
|---|---|---|---|
| NGTL System (TC Energy) | Willow Valley Interconnect — measured volume | 137.0 MMcf/d | -3.4 (-2.4%) |
| Westcoast Energy (Enbridge) | Sunset Creek West — scheduled nominations | 497.4 thousand/d | +0.0 (+0.0%) |
Gas day 2026-10-25, the latest with both postings. These are the two publicly posted deliveries into Coastal GasLink, the only pipeline serving the terminal; Coastal GasLink itself publishes no flow data. Each figure is shown exactly as its pipeline posts it — NGTL as a measured volume, Westcoast as scheduled nominations in its own commercial units — so the two rows are not in the same unit and do not add. They carry only part of the plant’s supply: gas owned by the project partners enters the pipeline without a public meter, which is why the headline figure is a scaled estimate rather than a sum. Δ DoD compares each posting with the previous gas day’s.
LNG Canada is tracked alongside the nine U.S. LNG export terminals but is not part of the U.S. total. See total U.S. LNG feedgas for the national picture and every terminal’s chart.